Compare Tableau to XLReporting in 7 Ways
 Edgar de Wit
One of the well-known names in Business Intelligence is Tableau.
This analytics platform, developed with the VizQL programming language, has been around since 2003. Tableau gives users the ability to create graphic and interactive dashboards. In 2019 they were acquired by Salesforce.
As a market leader, Tableau has a lot to offer. But it comes at a high price level, and can be seen as an "Enterprise" solution.
We are comparing Tableau with XLReporting in seven ways. What are the pros and cons? What is Tableau good at and how does it compare to XLReporting?
1Reporting
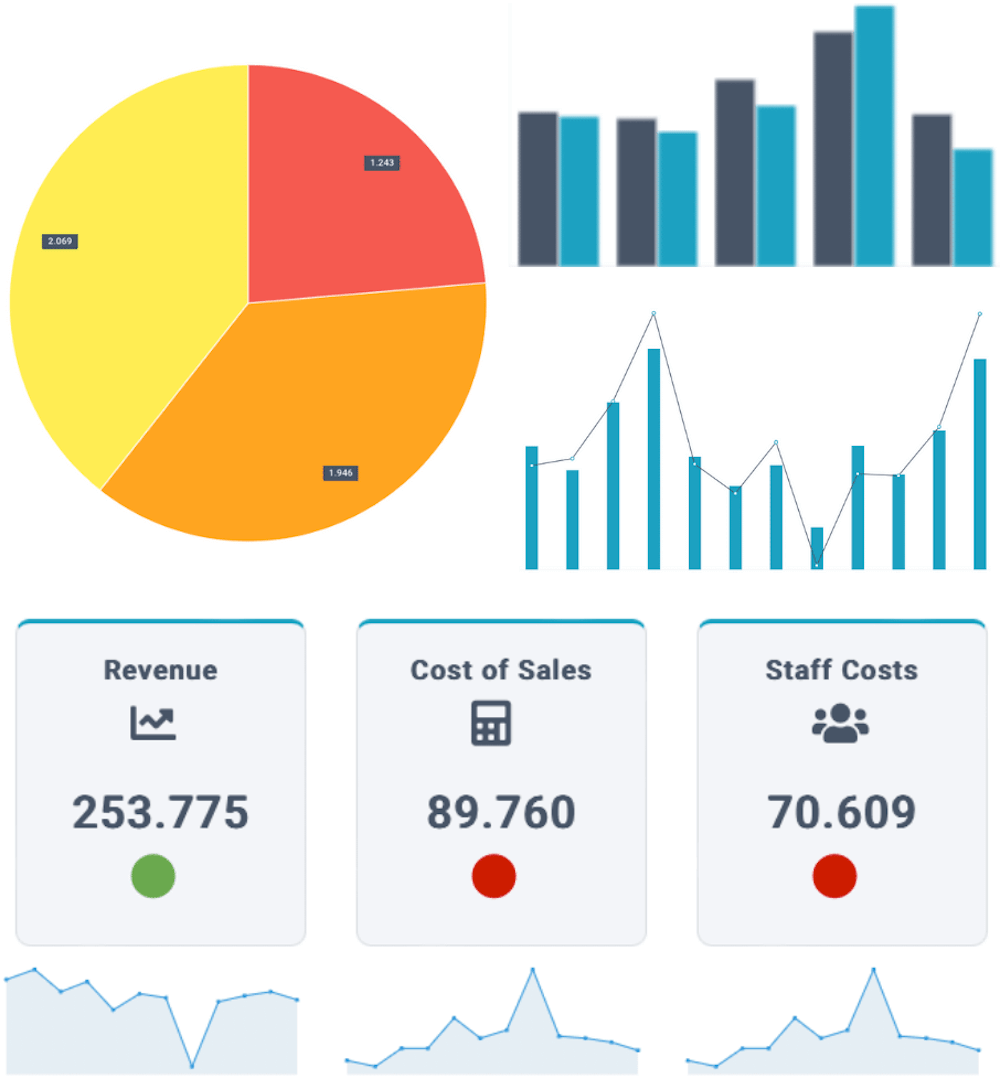
The purpose of Tableau is visualization. The VizQL programming language is a toolbox of visualizations. Almost any kind of dashboard is possible. From pivot tables to geo maps. In each visualization, you can zoom into the desired level.
The possibilities are endless, but that also has consequences.
When we look at the user experience, Tableau has a high learning curve. That is unavoidable with so much flexibility. Tableau compensates that with extensive consulting, training options, and a help center.
XLReporting deliberately only offers the most commonly used report types and visualizations available. Still, that is 30+ different types. And that also includes pivot tables and geo maps, and zooming in.
XLReporting also limits the number of options in visualization. In our experience, that is more than sufficient for almost every business, and it keeps things simple for our users. Our motto is "less is more".
As a result, the learning curve is low. After only a short training or watching our videos, users can create their own charts.
2Planning
Tableau can only be used to visualise your data on dashboards. Tableau has no financial consolidation, financial reporting, planning or data-entry capabilities.
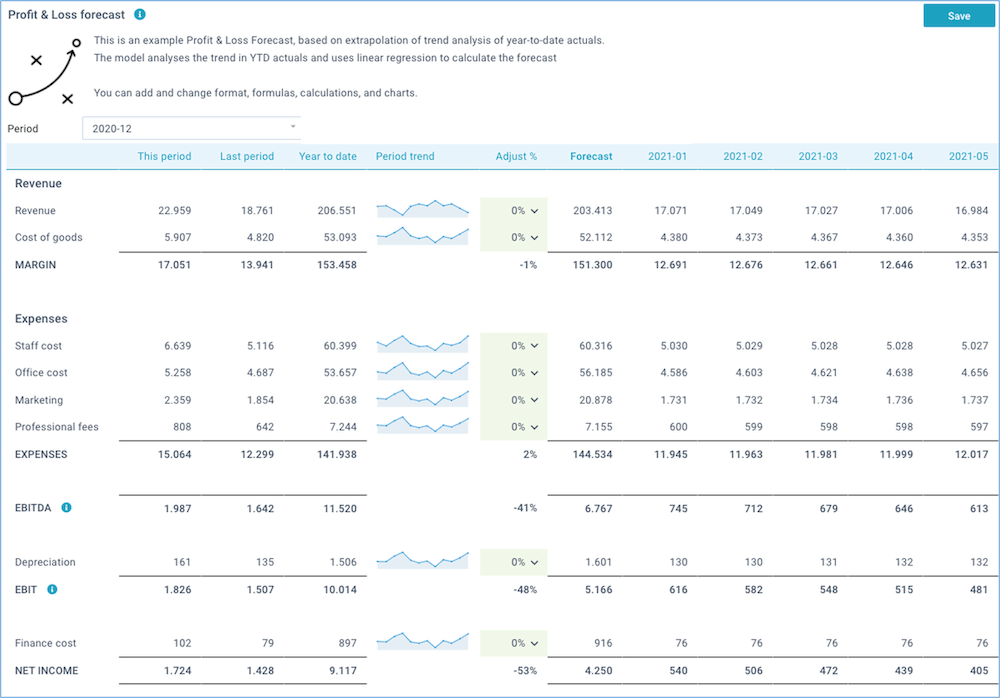
In XLReporting, you can create your planning models as easy as reports. Your planning data is immediately consolidated and visible in your reports and dashboards.
3Complexity
Tableau is quite complex to install within your organization. You need the following components:
- Tableau Prep Builder or other ETL software. For data loading, preparation, modeling, and calculation.
- Tableau Desktop to create the visualizations and implement updates.
- A Tableau Data management Add-on. Automates your setup and manages the data flows.
- Tableau Online or Server: To share content and authorize users.
- Web browser: For requesting the visualizations.
Installing Tableau is a significant IT project. By comparison, XLReporting is so much easier: you do not need to install anything. Everything runs in the browser and you can start right away.
4Scalability
The visualizations in Tableau demand a lot of server capacity. Especially as your users and data increases. As soon as the performance slows down, you'll have to scale up your server capacity.
XLReporting has been developed for scalability. It doesn't matter if you work with 10 or 1,000 users, you won't have to do anything.
XLReporting is highly optimized and runs on our servers. If the servers need more capacity, it is automatically adjusted. You won't even notice, and this happens at no extra cost to you.
5Support
Tableau has many support options, such as online video training, knowledge base, implementation partners, and a user community.
XLReporting has an extensive support center including tutorial videos. Our customers are supported by finance experts (not by automated bots or a help desk).
6Pricing
Tableau is an Enterprise solution, which shows in a pricing structure that consists of multiple components:
- Per User: Price starts from $15 to $75 per month.
- Add-ons: such as "Data Management" for $5.50 per user per month.
- Additional Resources: Starts at $2,165 per month.
- Servers, VMs, and desktops: for automating data flows.
- Training and consultancy at extra cost.
Tableau starts with a minimum purchase of 100 users, 6 administrators, and one resource block. The minimum commitment starts at $2,613 per month.
XLReporting does not have pricing per user or server. You pay only for the number of reports and models that you create.
XLReporting starts at $500 a month for 20 reports, unlimited users, and data. For a complete reporting, consolidation, and budgeting platform.
7User experience
You can find many user reviews of Tableau. With 3,000+ reviews at Gartner and 1,500+ at Capterra, you can read different experiences.
These are the most common positives and negatives of Tableau:
Pros
- BI leader
- Many links with data
- Support and community
Cons
- High and inflexible cost
- High investment in training
- Slow performance
Conclusion
Tableau is big in Business Intelligence. But it does come with a heavy installation, training, and price tag. Your IT department needs to manage, maintain, and update Tableau.
Do you want more than just dashboards and visualizations? Do you want to do budgeting and forecasting as well as consolidation and financial reporting? With a low learning curve at an affordable price, XLReporting is the right tool for you.

Contact us to request a demo or POC. We'll show you how XLReporting can add value to your company.
← Back to homeFind a blog
Home |
By topic | By title | By author | By dateBudgeting
- Find the Dimensions in your Business
- Build effective Budget Models
- Build the Right Budget Structure for your Business
- Improve Reporting, Budgeting and Analysis in 5 steps
- Best Practices Budgeting Tool for Non-Profit
- Important Financial Statements for Non-Profit Organizations
- How to Deal with a Reorganization when Budgeting
- Uncovering the Hidden Costs of Forecasting in Excel
- Budgeting in times of Economic Decline: How to stay in control
- Which financial solution fits your organization?
- Budgeting beyond traditional boundaries: A smarter approach
- XLReporting: a trusted European alternative in uncertain times
- Involving your team in budget planning
- Why Revenue Forecasting Matters
- The One-Stop Solution for Finance Professional
- A $28 Billion Excel Sheet: Why Finance Needs Better Tools
- Why Finance Teams Are Shifting to Automated Rolling Forecasting
Cashflow
- The Importance of Cashflow Forecasting
- Reduce Cash Management Risk
- Maximize the Power of Cash Flow Analysis
- Analyze Past Cash Flow: A Critical Step
- Effective Tools and Methods for Cash Flow Forecasting
- How to Do Cash Flow Forecasting in Xero
Consolidation
- A step-by-step Guide to Financial Consolidation
- A Guide to Consolidation with QuickBooks
- 5 Ways XLReporting can help your organization
- Not an April fool: The high cost of low quality data
- The Complete Guide to Financial Consolidation with XLReporting
- XLReporting: a trusted European alternative in uncertain times
- The One-Stop Solution for Finance Professional
- A $28 Billion Excel Sheet: Why Finance Needs Better Tools
Forecasting
- Improve Reporting, Budgeting and Analysis in 5 steps
- The Importance of Cashflow Forecasting
- Reduce Cash Management Risk
- Analyze Past Cash Flow: A Critical Step
- Effective Tools and Methods for Cash Flow Forecasting
- How To Forecast Revenue With Ease
- Integrate Xero with Reporting and Forecasting: Step-by-Step
- How to Do Cash Flow Forecasting in Xero
- Questions to ask Forecasting Software Vendors
- Why Forecasting with Excel won't let your Organization Excel
- Work together for Successful Investment Planning
- Uncovering the Hidden Costs of Forecasting in Excel
- Budgeting in times of Economic Decline: How to stay in control
- Still combining PowerBI with Excel for your management reports?
- Which financial solution fits your organization?
- Budgeting beyond traditional boundaries: A smarter approach
- Involving your team in budget planning
- Why Revenue Forecasting Matters
- Why Finance Teams Are Shifting to Automated Rolling Forecasting
Non-Profit
Quickbooks
Releases
- What is new in release 35
- What is new in release 36
- What is new in release 37
- What is new in release 38
- What is new in release 39
Reporting
- Find the Dimensions in your Business
- Find the Right Metrics in your Business
- Improve your Reporting in 5 steps
- Minimize Headaches at Reorganizations
- Report on Xero Tracking Categories
- Free up Time from Monthly Financial Reporting
- Improve Reporting, Budgeting and Analysis in 5 steps
- Define extra dimensions
- Maximize the Power of Cash Flow Analysis
- Analyze Past Cash Flow: A Critical Step
- Why Good Financial Data Quality is Crucial for Your Business
- Integrate Xero with Reporting and Forecasting: Step-by-Step
- Important Financial Statements for Non-Profit Organizations
- Best Reporting Options for Simplifying QuickBooks Desktop
- How to Supplement Information to your HR system
- The Importance of ISO 27001 Certification
- Allocating Funds in Educational Budgeting
- Financial scenario planning - the Why and How
- Our AI Assistant ensures better reporting
- Key Pain Points in Accounting and How to Solve Them
- Still combining PowerBI with Excel for your management reports?
- Which financial solution fits your organization?
- 5 Ways XLReporting can help your organization
- Not an April fool: The high cost of low quality data
- The Complete Guide to Financial Consolidation with XLReporting
- XLReporting: a trusted European alternative in uncertain times
- Involving your team in budget planning
- The One-Stop Solution for Finance Professional
- A $28 Billion Excel Sheet: Why Finance Needs Better Tools
Review
- Year review of 2021
- Compare Tableau to XLReporting in 7 ways
- Compare Power BI to XLReporting in 7 ways
- Year review of 2022
- XLReporting named as Key Player in Budgeting Software Market
- Year review of 2023
- The Importance of ISO 27001 Certification
- Financial scenario planning - the Why and How
- Year review of 2024
Setup
- Find the Dimensions in your Business
- Build effective Budget Models
- Optimize your Chart of Accounts
- Find the Right Metrics in your Business
- Improve your Reporting in 5 steps
- Stop relying on spreadsheets
- Minimize Headaches at Reorganizations
- Report on Xero Tracking Categories
- Build the Right Budget Structure for your Business
- Free up Time from Monthly Financial Reporting
- Improve Reporting, Budgeting and Analysis in 5 steps
- Define extra dimensions
- Why Good Financial Data Quality is Crucial for Your Business
- Key Pain Points in Accounting and How to Solve Them
Xero
5
A
- A $28 Billion Excel Sheet: Why Finance Needs Better Tools
- A Guide to Consolidation with QuickBooks
- A step-by-step Guide to Financial Consolidation
- Allocating Funds in Educational Budgeting
- Analyze Past Cash Flow: A Critical Step
B
- Best Practices Budgeting Tool for Non-Profit
- Best Reporting Options for Simplifying QuickBooks Desktop
- Budgeting beyond traditional boundaries: A smarter approach
- Budgeting in times of Economic Decline: How to stay in control
- Build effective Budget Models
- Build the Right Budget Structure for your Business
C
D
E
F
- Financial scenario planning - the Why and How
- Find the Dimensions in your Business
- Find the Right Metrics in your Business
- Free up Time from Monthly Financial Reporting
H
- How To Forecast Revenue With Ease
- How to Deal with a Reorganization when Budgeting
- How to Do Cash Flow Forecasting in Xero
- How to Supplement Information to your HR system
I
- Important Financial Statements for Non-Profit Organizations
- Improve Reporting, Budgeting and Analysis in 5 steps
- Improve your Reporting in 5 steps
- Integrate Xero with Reporting and Forecasting: Step-by-Step
- Involving your team in budget planning
K
M
N
O
Q
R
S
T
- The Complete Guide to Financial Consolidation with XLReporting
- The Importance of Cashflow Forecasting
- The Importance of ISO 27001 Certification
- The One-Stop Solution for Finance Professional
U
W
- What is new in release 35
- What is new in release 36
- What is new in release 37
- What is new in release 38
- What is new in release 39
- Which financial solution fits your organization?
- Why Finance Teams Are Shifting to Automated Rolling Forecasting
- Why Forecasting with Excel won't let your Organization Excel
- Why Good Financial Data Quality is Crucial for Your Business
- Why Revenue Forecasting Matters
- Work together for Successful Investment Planning
X
- XLReporting named as Key Player in Budgeting Software Market
- XLReporting: a trusted European alternative in uncertain times
Y
2025
- Why Finance Teams Are Shifting to Automated Rolling Forecasting
- A $28 Billion Excel Sheet: Why Finance Needs Better Tools
- The One-Stop Solution for Finance Professional
- Why Revenue Forecasting Matters
- Involving your team in budget planning
- XLReporting: a trusted European alternative in uncertain times
- Budgeting beyond traditional boundaries: A smarter approach
- The Complete Guide to Financial Consolidation with XLReporting
- Not an April fool: The high cost of low quality data
- 5 Ways XLReporting can help your organization
- Which financial solution fits your organization?
- Still combining PowerBI with Excel for your management reports?
- Budgeting in times of Economic Decline: How to stay in control
- Key Pain Points in Accounting and How to Solve Them
2024
- Year review of 2024
- What is new in release 39
- Our AI Assistant ensures better reporting
- Financial scenario planning - the Why and How
- Allocating Funds in Educational Budgeting
- The Importance of ISO 27001 Certification
- How to Supplement Information to your HR system
- Best Reporting Options for Simplifying QuickBooks Desktop
- Uncovering the Hidden Costs of Forecasting in Excel
- Work together for Successful Investment Planning
- Why Forecasting with Excel won't let your Organization Excel
- Questions to ask Forecasting Software Vendors
- How to Deal with a Reorganization when Budgeting
- What is new in release 38
2023
- Year review of 2023
- Important Financial Statements for Non-Profit Organizations
- How to Do Cash Flow Forecasting in Xero
- Integrate Xero with Reporting and Forecasting: Step-by-Step
- How To Forecast Revenue With Ease
- Why Good Financial Data Quality is Crucial for Your Business
- Best Practices Budgeting Tool for Non-Profit
- Effective Tools and Methods for Cash Flow Forecasting
- XLReporting named as Key Player in Budgeting Software Market
- Analyze Past Cash Flow: A Critical Step
- Maximize the Power of Cash Flow Analysis
- Reduce Cash Management Risk
- A Guide to Consolidation with QuickBooks
2022
- Year review of 2022
- What is new in release 37
- A step-by-step Guide to Financial Consolidation
- The Importance of Cashflow Forecasting
- What is new in release 36
- Define extra dimensions
- Improve Reporting, Budgeting and Analysis in 5 steps
- Free up Time from Monthly Financial Reporting
- Build the Right Budget Structure for your Business
- Compare Power BI to XLReporting in 7 ways
- Report on Xero Tracking Categories
- What is new in release 35
- Compare Tableau to XLReporting in 7 ways
- Minimize Headaches at Reorganizations