Introduction
This is the support center. The main menu in XLReporting consists of these sections:
- Favorites (only visible if you have favorites) - this shows your favorite reports and models, so they are all available at a glance. Read how to use your dashboard.
- Dashboard (only visible if you have dashboards) - this shows the personalized dashboards that you created, or that other users have shared with you, all available at a glance. Read how to use your dashboard.
- Your menu (you can create your own menu navigation) - this is where you can run your reports and models, import data, and edit data. Read how to run reports, run models, import data, or edit data.
- Define - this is where you can define your configuration. When you sign up, your tenant already has a basic configuration, aimed at financial reporting. You don't have to start from scratch, you have working examples which you can start with. You can create new or change configuration at any point in time. Read how to define reports, models, imports, or data sets.
- Manage - this is where you can change your profile, tenant details, and add or change users, user roles and permissions, and menu groups.
- Support - this gives acces to our support center, and other user documentation. You can also contact us if you need further support.
You can also watch the Introduction video.
If you're new to XLReporting, we recommend that you start using our predefined imports, reports, and models and familiarize yourself with the default configuration before you define your own. We also recommend you read about navigation and useful tips.
You can also watch all instruction videos.
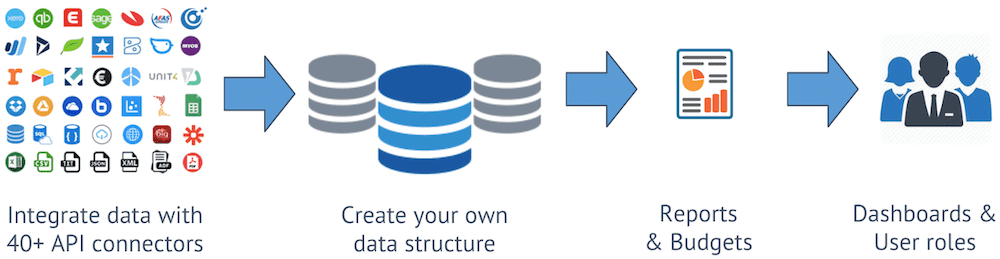
Data flow
This diagram shows the overall data flow in XLReporting:
Define your own objects
You can define XLReporting with 4 types of objects:
- Data sets - configurable objects that store your data (think of them as Excel worksheets, or database tables, or tabular lists). You can give each data set a name, define its columns, set user permissions, and import data.
- Imports - configurable objects that ensure data from other systems or files can be repeatedly and consistently converted and imported into data sets in XLReporting. You can give each import a name, define the source data, the target data set, the column mapping, conversions, data filters, and set user permissions.
- Reports - configurable objects that define how information from your data sets will be combined and presented into reports and charts. You can give each report a name, define the source data, multiple layouts, report fields, conversions, filters, and set user permissions.
- Models - configurable objects that combine data
queries with spreadsheet-like templates, enabling you to build advanced reporting and
interactive planning models. You can give each model a name, define the template, create
formulas and logic, add queries, and set user permissions. Models are typically used for 2
different purposes:
- Reporting - build your own custom reports. You can combine very diverse types of data into one model, apply your own format, add formulas, functions, and calculations, and integrate charts, icons, links, and images in your model.
- Planning - build interactive planning models. You can pull data into your model, define cell editors, and allow users to enter data into the model in designated cells. You can apply formulas, functions, and calculations, and save the results back into data sets.
You can create new objects at any time by clicking on the New button.