Financial periods | Variance analysis | Accounts mapping | Currency translation | Cost centers
Tutorials - Common tasks
On this page we explain a number of examples for common financial tasks.
Financial periods
You can perform complex selections and operations on financial periods, such as:
- Show period-discrete and year-to-date amounts, based on a selected period.
- Show prior period, last year, year-to-go, and full year, based on the current period.
- Compare actuals to budgets and forecasts for each of the periods.
- Automatically deal with fiscal years and calendar years.
We have created a library of powerful PERIODSUM() functions for this purpose.
Examples:
(assuming the selected period is 2019-03)
PERIODSUM(data,
"PER") returns the sum for 2019-03
PERIODSUM(data, "YTD") returns the sum for 2019-01 to
2019-03
Variance analysis
Most reports include some form of variance analysis. Comparing A to B, or comparing A in this year versus last year etc.
You can perform complex calculations, comparisons, and logical operations by using functions, expressions with multiple functions and operators. You would typically do this using calculated fields in reports, or using queries and formulas in models.
You would usually do these calculations with conditional logic in your reports and models, for example:
Examples:
IF(type = "Actuals", Amount, 0)
(Actuals / Budget) - 1
But for comparisons that you do very often with logic that is not likely to change (for example comparing actuals and budget side-by-side), it can make sense to create separate columns in your data sets, and calculate and store the appropriate values during the data import. This avoids having to repeat the logic many times in multiple reports.
Chart of Accounts mapping
XLReporting can automatically convert local (or divergent) account codes to a common Chart of Accounts, so that you build your reports on a common Chart of Accounts. Here is how you can define that:
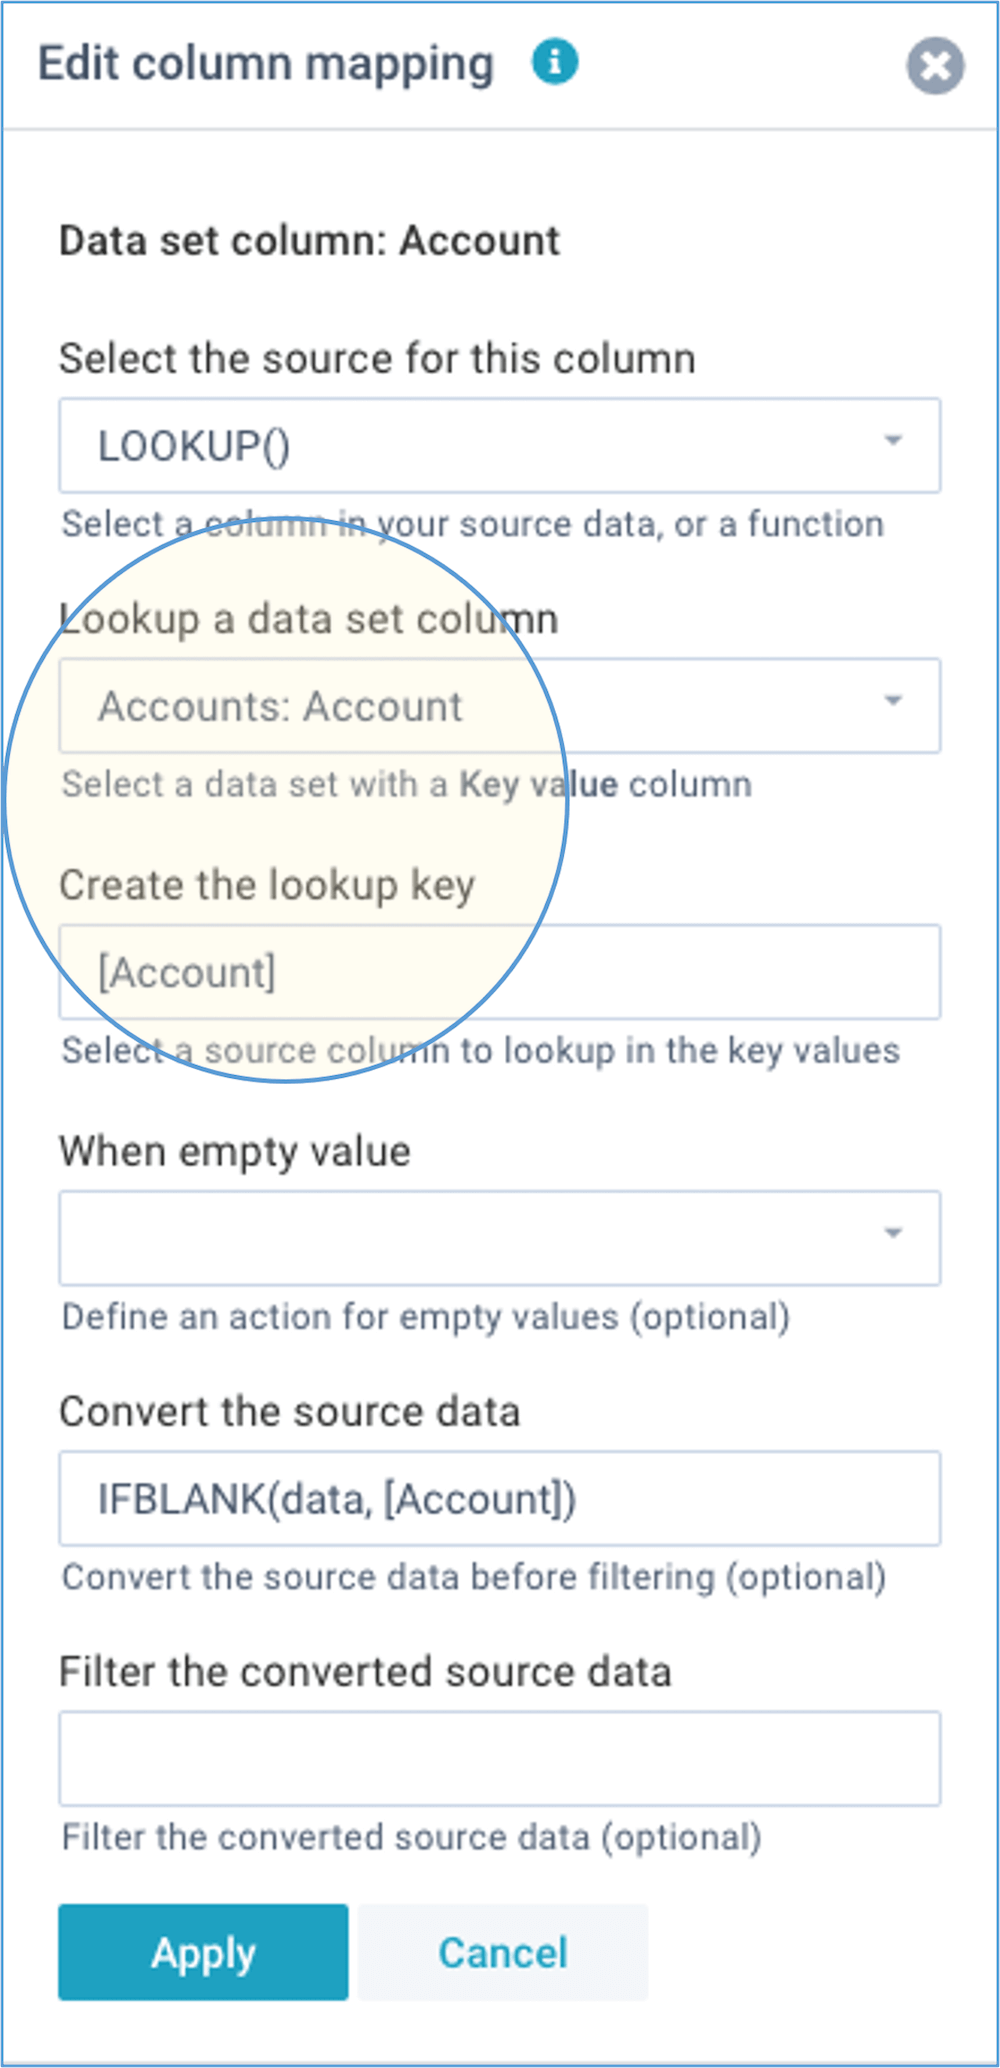
- Create a data set that holds the locally used account codes and a mapping to your common Chart of Accounts. This data set will only be used for lookups. The key column of that data set typically is the local account code. In some case, when different companies use the same account code for different purposes, you might need to construct the key value based on company code + account code.
- In your import mapping, perform a LOOKUP on this data set to return the common account code. You might need to construct the key value based on multiple colums in your source data.
- Use an IFBLANK function to return a default value if the lookup comes back empty. The default value could be the local account code, in which case accounts would only be converted if there is a related entry in the accounts mapping, else the local account code would be used as it is.
- Store the result (the common account code) into your financial data set.
It may seem complex to you at first, but it is all done in just 1 window:
Currency translation
XLReporting can automatically look up the relevant exchange rates for foreign currency amounts and apply those to the imported amounts. Here is how you can define that:
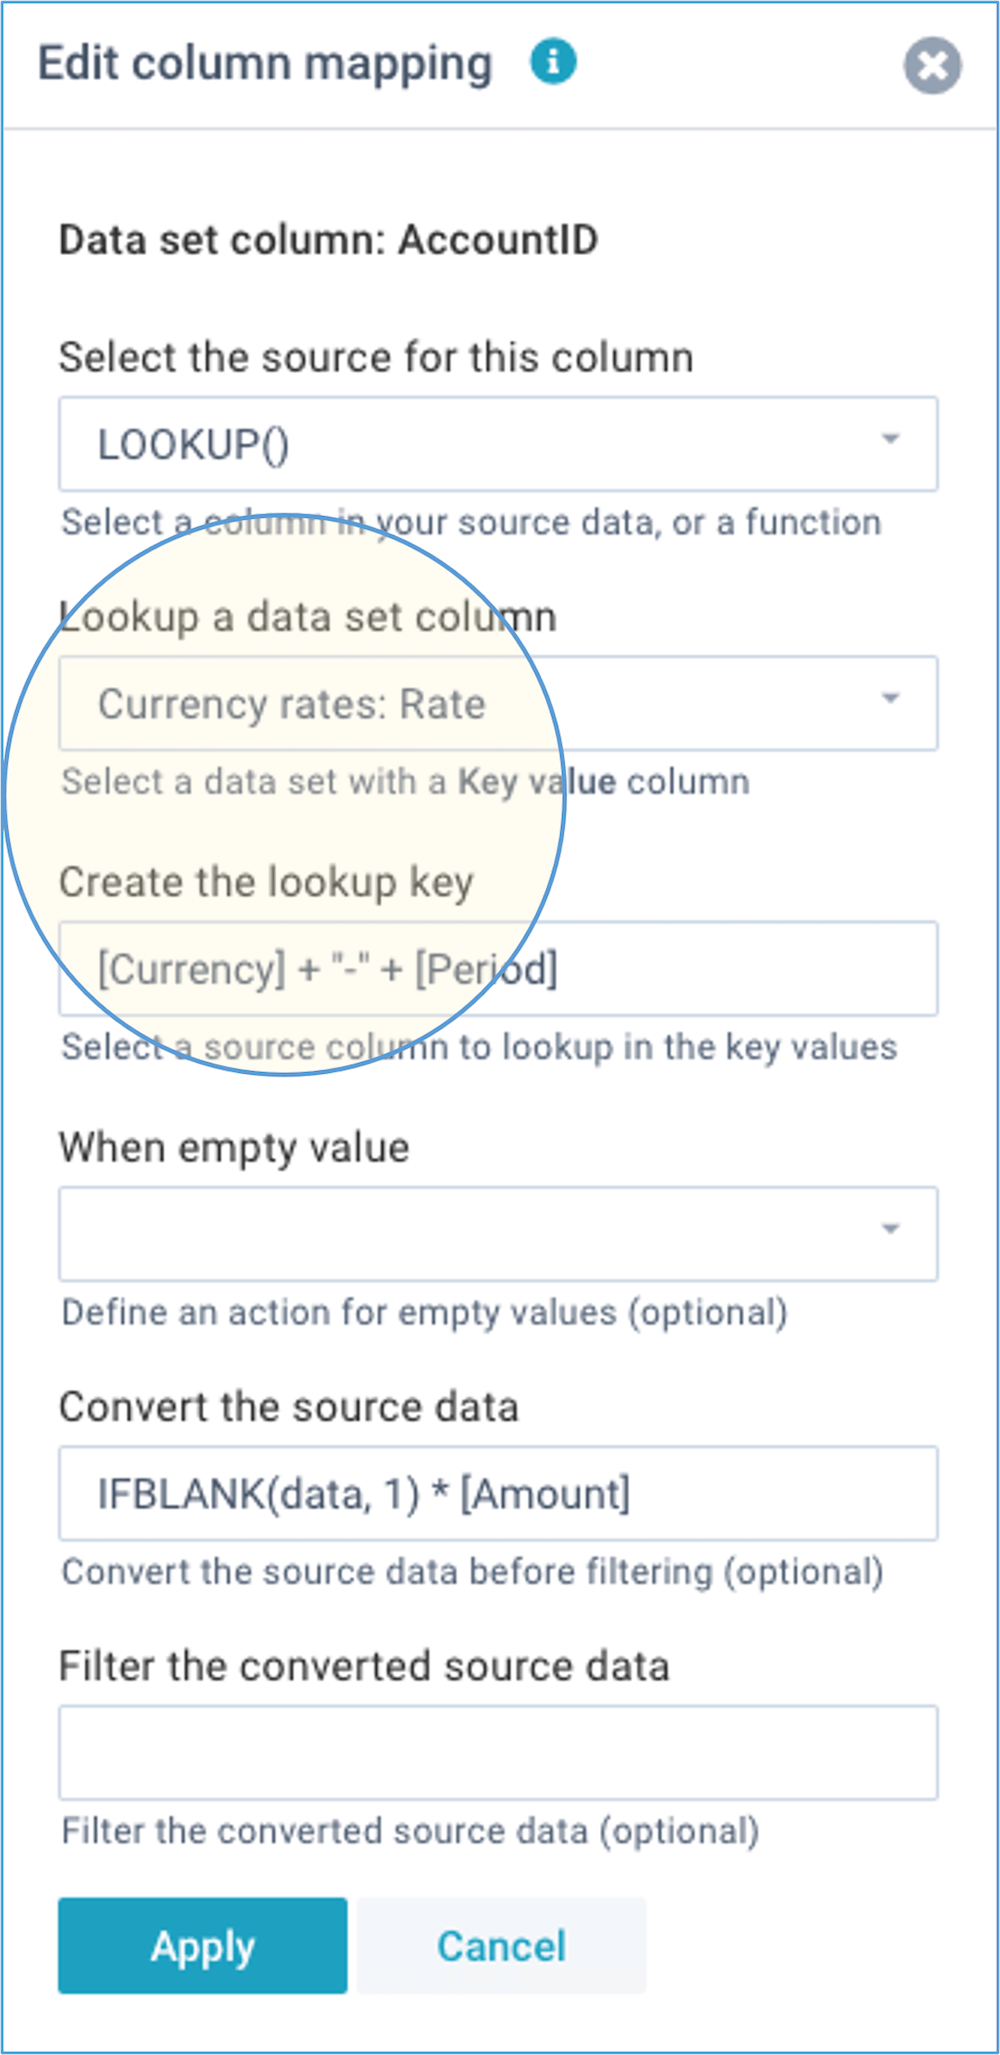
- Create a data set that holds the currency exchange rates. This data set will only be used for lookups. The key column of that data set typically is a combination of currency code and period. For example: "EUR-2019" would be the key, with 1.06 its currency exchange rate. Ofcourse, you can adapt this logic to support different rates, for example actuals vs budget.
- In your import mapping, perform a LOOKUP on this data set to get the currency exchange rate. You can construct the key value based on multiple colums in your source data.
- Use an IFBLANK function to return a default value of 1 if the lookup comes back empty, and apply that to the amount in the source data. The result will be stored into your financial data set.
It may seem complex to you at first, but it is all done in just 1 window:
Cost centers or business units
The demo data in XLReporting uses only chart of accounts and companies, but you can add extra details such as cost centers or business units, departments, product groups etc. Here is how you can define that:
- Create a data set that defines the extra data, say business units. One column needs to have data type key value and contain unique values (e.g. the business unit codes). The other columns can contain description, type, groups etc, that's all up to you.
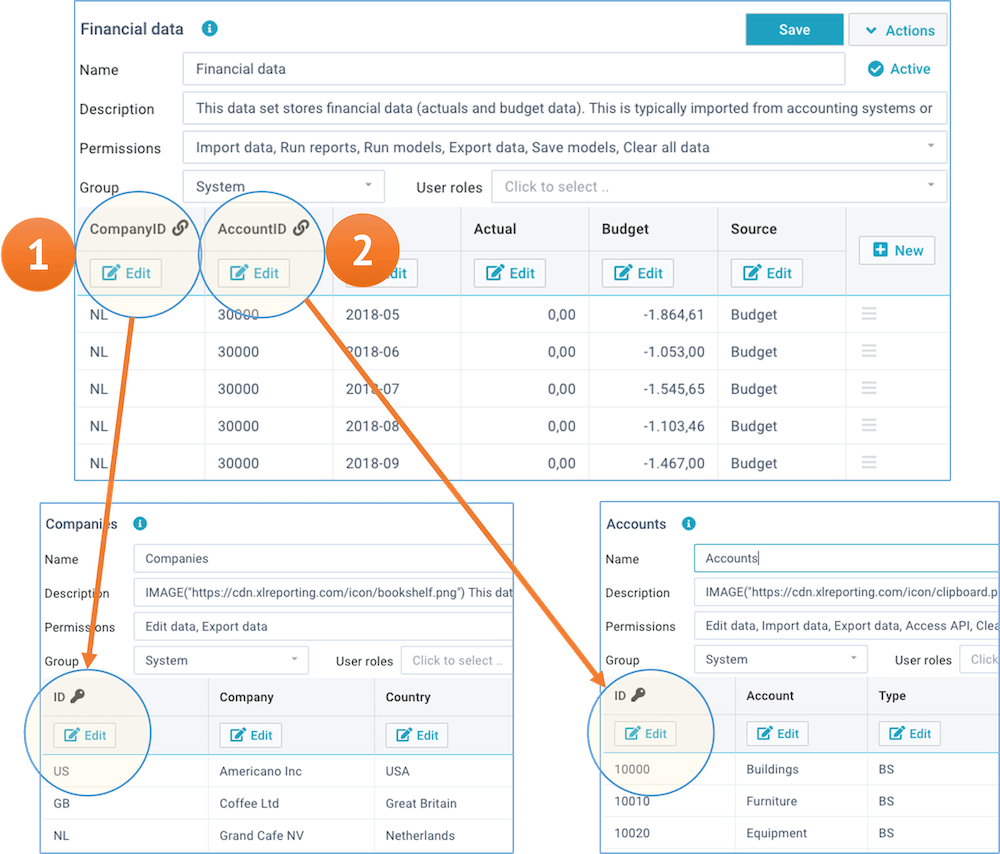
- In the data set Financial data, add an extra column with data type Linked value and link it to the data set that you just created. The values between a Linked value in a data set and the Key value in a related data set need to correspond. XLReporting validates the data during import and user editing. Linked data sets -and their combined columns- will be jointly available in reports.
The below example shows how a Linked value is used: